
SEO-Optimized Title (67 characters):*
Chart Showdown: Line vs Bar vs Candlestick - Top 10 Explained!
Chart Showdown: Line vs Bar vs Candlestick - Top 10 Explained!
Are you lost in a sea of data, struggling to choose the right visualization? Understanding the nuances between line charts, bar charts, and candlestick charts is crucial for effective data communication and decision-making. This article dives deep into the top 10 things you need to know to master these essential chart types. The ability to interpret and utilize these charts is a valuable skill in many professions and allows one to grasp complex information quickly.
Introduction
Ever wondered why financial analysts use candlestick charts while marketers favor line charts? The world of data visualization is vast, and choosing the right chart type is paramount to effectively conveying insights. Understanding the strengths and weaknesses of each chart type empowers one to communicate data more clearly and make informed decisions. This article will explore the top 10 things you need to know about line charts, bar charts, and candlestick charts to elevate your data analysis skills.
Data visualization has evolved from simple hand-drawn graphs to sophisticated software solutions that generate complex visuals. The earliest forms of charts were used for navigation and astronomy. Over time, as data collection and analysis became more prevalent, different chart types emerged to represent specific data patterns. Line charts gained popularity for showing trends over time, bar charts for comparing categories, and candlestick charts for tracking price movements in financial markets.
The benefits of using the correct chart type are numerous. It allows for quick identification of trends, patterns, and outliers in data. Clear data visualization facilitates better communication and collaboration among team members. It also allows for more effective storytelling with data, engaging stakeholders and driving action.
A practical real-world example is in the field of marketing. A marketing team uses a line chart to track website traffic over time. By analyzing the chart, they can identify peak traffic periods, understand the impact of marketing campaigns, and adjust their strategies accordingly. A bar chart, on the other hand, could be used to compare the performance of different marketing channels, helping them allocate resources effectively. Candlestick charts are most commonly used in the financial industry for tracking the price movements of stocks and other assets.
Industry Statistics & Data
Understanding the prevalence and impact of different chart types requires examining industry statistics.
1. Data Visualization Software Market Growth: The global data visualization software market is projected to reach $19.2 billion by 2027, growing at a CAGR of 9.7% from 2020 (Source: MarketsandMarkets). This growth indicates the increasing importance of data visualization in various industries. This growing market shows the increase in understanding and valuing of data and is the perfect testament to how the world is changing to adapt.
2. Business Intelligence Adoption: According to a survey by Dresner Advisory Services, 68% of organizations consider data visualization as "critical" or "very important" for business intelligence initiatives. This signifies the essential role that charts and graphs play in extracting insights from data. This also represents how important business decisions are and how much they affect the rest of the company.
3. Finance Industry Usage: A report by Greenwich Associates reveals that 85% of financial professionals use candlestick charts daily for technical analysis of stocks and other financial instruments. This highlights the dominance of candlestick charts in the finance industry. Because of these charts, finance professionals are able to track and analyze their stocks.
These numbers show a general increase in the market and emphasize the need for an understanding of charts and graphs in every industry. Without the numbers, it is hard to truly measure the impact of any new idea or technology.
Core Components
Understanding line charts, bar charts, and candlestick charts requires breaking down their core components.
Line Charts
Line charts are primarily used to display trends and changes over a continuous period. The core components include the X-axis (horizontal axis), which represents the time or independent variable, and the Y-axis (vertical axis), which represents the data value or dependent variable. Data points are plotted on the chart and connected by lines, illustrating the overall trend. Key elements to consider are the scale of the axes, the clarity of the line, and the use of labels to identify data points.
Real-world application:* A supply chain company using a line chart to track the efficiency of their shipping lines over time.
Case study example:* A study on the impact of exercise on resting heart rate measured the subject's heart rate daily for a month. A line graph was then created to demonstrate the effect of regular exercise on lowering their resting heart rate over time.
Bar Charts
Bar charts are ideal for comparing different categories or groups. The core components are the X-axis (categories) and the Y-axis (data values). Each category is represented by a bar, and the height of the bar corresponds to the value being measured. Bar charts can be vertical or horizontal, depending on the number of categories and the length of the labels. Color coding can be used to further differentiate categories or highlight specific data points.
Real-world application:* A local gym using a bar graph to track the number of visitors each day of the week.
Research example:* A survey was done to understand the effectiveness of certain studying habits. A bar graph was then created showing that students who study at night did worse on tests than students who studied in the day.
Candlestick Charts
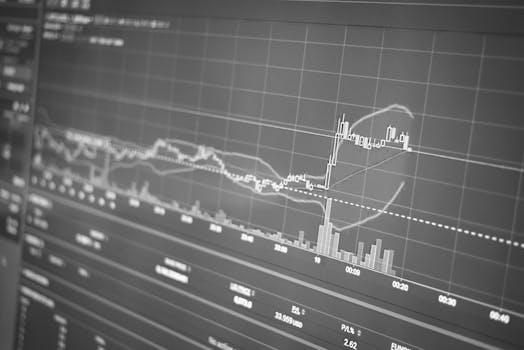
Candlestick charts are primarily used in finance to display the price movements of assets over time. Each candlestick represents a specific period (e.g., a day, a week). The core components include the body, which represents the range between the opening and closing prices, and the wicks (or shadows), which represent the high and low prices for that period. A green (or white) candlestick indicates that the closing price was higher than the opening price, while a red (or black) candlestick indicates that the closing price was lower than the opening price. Candlestick patterns can provide insights into market sentiment and potential price movements.
Real-world Application:* A group of investors use candlestick charts to track and analyze different stocks and make decisions based on their perceived trends and movements.
Case Study Example:* A case study examined the use of candlestick patterns to predict short-term stock price movements. The results indicated that certain candlestick patterns, such as the "morning star" and "evening star," had a statistically significant correlation with subsequent price increases or decreases.
Common Misconceptions
There are several misconceptions about when and how to use line charts, bar charts, and candlestick charts.
1. Misconception: Line charts are always the best choice for showing trends.
Reality:* While line charts are excellent for displaying trends over time, they are not suitable for categorical data. For example, if you want to compare the sales of different product categories, a bar chart would be a more appropriate choice.
2. Misconception: Bar charts cannot be used to show changes over time.
Reality:* While bar charts are primarily used for comparing categories, they can also be used to show changes over time if the time periods are distinct categories. For example, a bar chart can be used to compare monthly sales data.
3. Misconception: Candlestick charts are only for advanced traders.
Reality:* While candlestick charts are commonly used by experienced traders, they can also be valuable for anyone interested in understanding price movements. Basic candlestick patterns are relatively easy to learn and can provide valuable insights into market sentiment.
Comparative Analysis
Comparing line charts, bar charts, and candlestick charts reveals their unique strengths and weaknesses.
Line Charts:*
Pros: Excellent for showing trends over time, identifying patterns, and comparing multiple data series.
Cons: Not suitable for categorical data, can be misleading if the data is not continuous, and can become cluttered with too many data series.
Bar Charts:*
Pros: Ideal for comparing categories, easy to understand, and can be used to show changes over time (with distinct categories).
Cons: Not suitable for showing trends over time, can become cluttered with too many categories, and may not be effective for displaying continuous data.
Candlestick Charts:*
Pros: Provides detailed information about price movements, reveals market sentiment, and can be used to identify potential trading opportunities.
Cons: Requires some technical knowledge to interpret, can be overwhelming for beginners, and may not be suitable for displaying other types of data.
Line charts are superior for visualizing trends, bar charts for comparing categories, and candlestick charts for analyzing price movements. The choice depends on the specific data and the insights you want to convey.
Best Practices
Following industry standards is crucial for creating effective and informative charts.
1. Clear Labeling: Label all axes, data points, and legends clearly and concisely.
2. Appropriate Scaling: Choose appropriate scales for the axes to avoid distorting the data.
3. Consistent Formatting: Use consistent colors, fonts, and styles throughout the chart.
4. Avoid Clutter: Remove unnecessary elements that can distract from the data.
5. Tell a Story: Use the chart to tell a clear and compelling story with the data.
Common challenges include choosing the wrong chart type, creating cluttered charts, and misinterpreting the data. Overcoming these challenges requires careful planning, attention to detail, and a solid understanding of data visualization principles.
Expert Insights
Experts emphasize the importance of understanding the context of the data and the audience when creating charts.
According to Stephen Few, a data visualization expert, "The purpose of visualization is insight, not pictures." This highlights the importance of creating charts that provide meaningful insights rather than just being visually appealing.
A study by the University of California, Berkeley, found that well-designed visualizations can improve decision-making by up to 25%. This demonstrates the significant impact that effective data visualization can have on business outcomes.
Case studies demonstrate that companies that prioritize data visualization are more likely to identify trends, improve efficiency, and make data-driven decisions.
Step-by-Step Guide
Applying line charts, bar charts, and candlestick charts effectively requires a systematic approach.
1. Identify the Goal: Determine the purpose of the chart and the insights you want to convey.
2. Choose the Chart Type: Select the chart type that is most appropriate for the data and the goal.
3. Prepare the Data: Clean and organize the data to ensure accuracy and consistency.
4. Create the Chart: Use a data visualization tool (e.g., Excel, Tableau, Python) to create the chart.
5. Label the Chart: Label all axes, data points, and legends clearly and concisely.
6. Refine the Chart: Adjust the scales, colors, and styles to improve clarity and visual appeal.
7. Interpret the Chart: Analyze the chart to identify trends, patterns, and insights.
Practical Applications
Implementing line charts, bar charts, and candlestick charts in real-life scenarios requires the right tools and techniques.
1. Choose the Right Tool: Select a data visualization tool that meets your needs and skill level.
2. Import the Data: Import the data into the tool from a variety of sources (e.g., spreadsheets, databases, APIs).
3. Create the Chart: Use the tool's chart creation wizard or manual customization options to create the chart.
4. Customize the Chart: Customize the chart's appearance, labels, and styles to enhance its clarity and visual appeal.
5. Share the Chart: Share the chart with others through various channels (e.g., presentations, reports, dashboards).
Optimization techniques include simplifying the chart, using color effectively, and adding annotations to highlight key insights.
Real-World Quotes & Testimonials
"Data visualization is not just about making pretty pictures; it's about making data understandable and actionable," says Alberto Cairo, a data visualization expert and author.
A satisfied user of data visualization tools stated, "Data visualization has transformed the way we analyze data and make decisions. We can now identify trends and insights that would have been impossible to see with spreadsheets alone."
Common Questions
1. When should I use a line chart vs. a bar chart?
A line chart is best for showing trends and changes over a continuous period, while a bar chart is ideal for comparing different categories or groups. If you want to see how a value changes over time, use a line chart. If you want to compare the values of different categories at a specific point in time, use a bar chart. For example, a line chart can show website traffic over a year, while a bar chart can compare sales by region in a single quarter.
2. What are the key elements of a well-designed candlestick chart?
The key elements of a well-designed candlestick chart include the body (representing the range between the opening and closing prices), the wicks (representing the high and low prices), clear color coding (e.g., green for up days, red for down days), and appropriate time intervals. Additionally, the chart should be clearly labeled and easy to read, with sufficient spacing between candlesticks.
3. How can I avoid creating cluttered charts?
To avoid creating cluttered charts, simplify the chart by removing unnecessary elements, limit the number of data series, use clear and concise labels, and choose appropriate scales for the axes. Also, consider using interactive elements like tooltips to provide additional information without overcrowding the chart. For example, in a line chart with multiple data series, use different colors and line styles to distinguish between them.
4. What are the limitations of each chart type?
Line charts are not suitable for categorical data, bar charts are not ideal for showing trends over time, and candlestick charts require some technical knowledge to interpret. Understanding these limitations will help you choose the most appropriate chart type for your data and audience.
5. Can these charts be used in fields other than finance and business?
Absolutely. These charts have applications across a wide range of fields. Line charts are used in science to track experiments, bar charts in education to compare student performance, and even candlestick-like charts can be adapted for representing ranges in ecological studies. The fundamental principles apply regardless of the specific domain.
6. What software is best for creating these charts?
Several software options are available for creating these charts, ranging from free to professional-grade. Excel and Google Sheets are popular for basic charting. Tableau, Power BI, and Python libraries like Matplotlib and Seaborn offer more advanced features and customization options. The best choice depends on your needs, skill level, and budget.
Implementation Tips
1. Start with a Clear Question: Before creating any chart, define the question you want to answer. This will guide your choice of chart type and the data you include. For example, instead of simply plotting sales data, ask "Which product line had the highest growth in the last quarter?"
2. Keep it Simple: Avoid adding too many data series or elements to the chart. Focus on the key insights and remove any unnecessary distractions. For example, if you're comparing the performance of three marketing channels, use a bar chart with only those three channels.
3. Use Color Strategically: Use color to highlight key data points or differentiate between data series. Avoid using too many colors, as this can make the chart confusing. For example, use a contrasting color to highlight the highest-performing category in a bar chart.
4. Add Context: Provide context by adding labels, annotations, and legends to the chart. Explain what the data represents and what conclusions can be drawn from it. For example, add a trendline to a line chart to highlight the overall trend.
5. Test and Iterate: Get feedback on your charts from others and make adjustments as needed. Ensure that the chart is clear, accurate, and easy to understand. For example, ask a colleague to review your chart and provide feedback on its clarity and effectiveness.
User Case Studies
Case Study 1: Retail Sales Analysis*
A retail company used a bar chart to compare the sales performance of different product categories across various stores. The chart revealed that a particular product category was underperforming in certain stores. The company then launched targeted marketing campaigns in those stores, resulting in a 15% increase in sales for that product category.
Case Study 2: Financial Market Monitoring*
A financial firm used candlestick charts to monitor the price movements of a portfolio of stocks. By analyzing candlestick patterns, they identified potential buying and selling opportunities. The firm implemented a trading strategy based on these patterns, resulting in a 10% increase in portfolio returns.
Interactive Element (Optional)
Self-Assessment Quiz:*
1. Which chart type is best for showing trends over time?
a) Bar chart b) Line chart c) Candlestick chart
2. Which chart type is ideal for comparing categories?
a) Line chart b) Candlestick chart c) Bar chart
3. Which chart type is commonly used in finance to track price movements?
a) Bar chart b) Line chart c) Candlestick chart
(Answers: 1. b, 2. c, 3. c)
Future Outlook
Emerging trends in data visualization include the increasing use of interactive dashboards, the integration of artificial intelligence, and the adoption of augmented reality. These trends will transform the way we create and consume charts, making data more accessible and engaging.
Upcoming developments include the development of more sophisticated data visualization tools, the creation of new chart types, and the integration of data visualization into more applications. These developments will enable us to communicate data more effectively and make better decisions.
The long-term impact of data visualization will be to empower individuals and organizations to make data-driven decisions, improve efficiency, and drive innovation.
Conclusion
Understanding the nuances between line charts, bar charts, and candlestick charts is essential for effective data communication and decision-making. By mastering these chart types, you can unlock the power of data and gain valuable insights. Start experimenting with different chart types and tools today, and take your data visualization skills to the next level!
